FMRI
Design of fMRI experiments
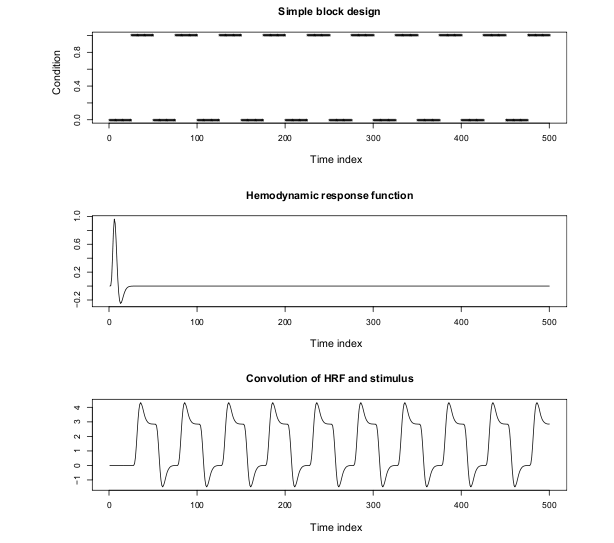
- block design
- stimulus is presented in blocks of fixed length (eg 30s), alternated with blocks of fixation (control condition)
- useful for locating voxels in which activity is significantly different from control baseline
- event-related design
- stimulus is presented in a brief flash, alternated with blocks of fixation for an interstimulus interval (ISI, eg 30s)
- can be more-flexible, and even subject-driven
- long ISI allows blood flow to return to baseline, allowing you to study the BOLD/HRF at a single voxel
Basic block analysis
- t-test: we are interested in the difference in activation between task and control stimulus
- For voxel i, <math>t_i = \frac{\bar{X}_{task} - \bar{X}_{control}}{se}</math> where
- <math>\bar{X}_{task}</math> is the average level of activation in voxel i over all times during which the task stimulus was displayed, and <math>\bar{X}_{control}</math> is the average over control
- <math>se = s_p \sqrt{\frac{1}{n_{task}} + \frac{1}{n_{control}}}</math> where
- pooled variance <math>s_p^2 = \frac{(n_{task} - 1)s^2_{task} + (n_{control} - 1)s^2_{control}}{n_{task} + n_{control} - 2}</math>where
- <math>n_{task}</math> and <math>n_{control}</math> are the number of observations under each condition
- <math>s^2_{task}</math> and <math>s^2_{control}</math> are the sample variances of the activations of the two conditions
- The result is called a statistical parametric map.
- If there is more than one task condition, you can generate an F statistic at each voxel.
- An alternative to the t-test is correlation analysis. For voxel i calculate
- <math>r_i = r(S, X_i)</math> where
- S is the pattern of zeros and ones describing the block design stimulus, and X is the activation time course of voxel i
- r is Pearson's correlation coefficient:
- <math>r(Y, Z) = \frac{\sum_{j=1}^n (Y_j - \bar{Y})(Z_j-\bar{Z})}{\sqrt{\sum_{j=1}^n (Y_j - \bar{Y})^2\sum_{j=1}^n (Z_j - \bar{Z})^2}}</math>
- in the case where there are exactly n/2 task trials and n/2 control trials, the correlation analysis reduces to the t-test:
- <math>t_i = r_i\sqrt{\frac{n-2}{1-r_i^2}}</math>
- trial averaging - trials are sorted by condition type and then standard t-test or correlation analysis is performed
- function estimation - trying to estimate the HRF function at each voxel (why?)
- parametric - we assume a certain functional form for the HRF and then estimate the parameters with the data
- nonparametric - may map with knotted spline curves, lots of Bayesian estimation
General Linear Model
- <math>Y = X\beta +\epsilon</math>, where
- Y is the measured responses, a matrix with one row for each time, one column for each voxel
- X is design matrix and includes
- binary or categorical variables reflecting the stimuli
- predicted hemodynamic response
- <math>\beta</math> the unknown coefficients of the design matrix, and
- <math>\epsilon</math> the error, usually assumed to be normal with mean zero and variance <math>\sigma^2</math>
- simplest approach assumes each voxel and time point independent and <math>\sigma^2</math> constant, so <math>\beta</math> can be estimated with least squares
- predicted hemodynamic response obtained by convolving the stimulus time course with a model for the HRF (e.g. gamma function model)
- <math>x_t = \int^\infty_0 h(u)s(t-u)du</math>
- The general linear model makes strong assumptions about independence that in practice that probably aren't realistic.

Mapping to a common brain (coregistration)
- Talaraich - a single postmortem brain with voxels defined at 1mm per side
- Montreal Neurological Institute (MNI) - average over 300 healthy brain scans
- nonlinear methods outperform simple affine transformations
Combining values from multiple subjects
We want to combine values at matching voxels over all subjects. There are many approaches, included simple average of the t statistic. A popular approach is to calculate the Fisher T statistic based on the p-value at each voxel:
<math>T_F = -2\sum_{i=1}^k \log{p_i}</math> where i sums over the k subjects